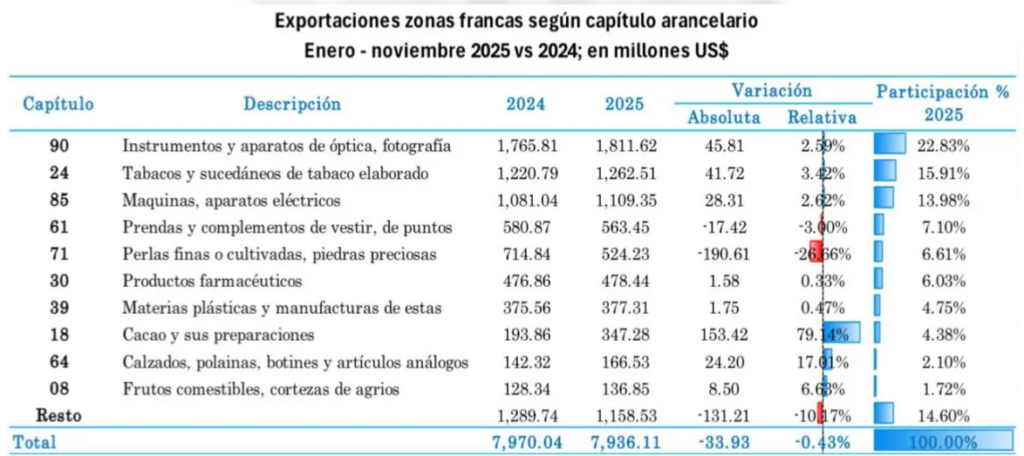
Between January and November 2025, free trade zone exports from the Dominican Republic totaled US$7.936 billion, according to data from the Dirección General de Aduanas (DGA).
Despite a 0.43% year-over-year decline compared to 2024, free trade zones remain the country’s primary export engine, accounting for 60.75% of total exports.
Export composition by economic destination:
- Consumer goods: 50.83%
- Capital goods: 33.26%
- Raw materials: 15.91%
This structure reflects the sector’s strong orientation toward manufactured goods with higher value added.
Leading export products:
- Tobacco and manufactured tobacco substitutes: 15.91%
- Electrical machinery and equipment: 13.98%
- Knitted apparel: 7.10%
Also standing out:
- Pearls and precious stones: 6.61%
- Pharmaceutical products: 6.03%
- Plastics: 4.75%
- Cocoa and cocoa preparations: 4.38%
- Footwear: 2.10%
- Fruits: 1.72%
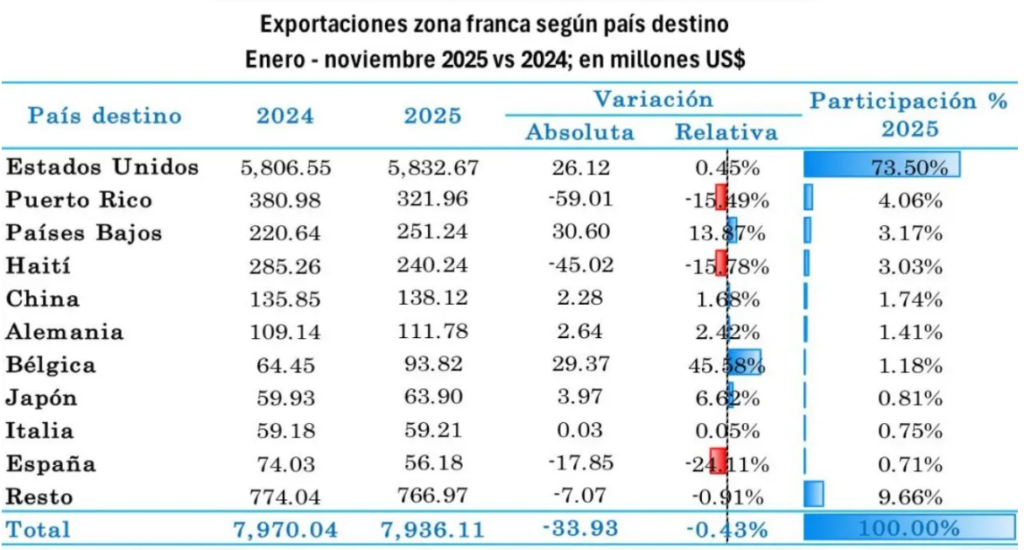
Export destinations:
In terms of destinations, 90.34% of free trade zone exports were concentrated in 10 countries, with the United States as the main market, absorbing 73.50% of total exports.
This was followed by:
- Puerto Rico: 4.06%
- Netherlands: 3.17%
- Haiti: 3.03%
- China: 1.74%
Other markets accounted for the remaining 9.66%.
Territorial distribution:
- San Cristóbal: 22.66%
- Santo Domingo: 21.78%
- Santiago: 14.85%
Logistics and customs operations:
- Maritime transport: 76.99%
- Air transport: 20.65%
- Land transport: 2.36%
In addition, 94.86% of shipments were processed through five customs administrations, led by:
- Haina Port: 39.87%
- Las Américas International Airport (AILA): 18.47%
- Caucedo Port: 15.42%
- Santo Domingo: 11.82%
- Puerto Plata: 9.28%
Source: